Resource Dimensioning Using Erlang-B and Erlang-C
Resource dimensioning is an important step of architecture design. The system architect needs to study the system performance requirements and come up with an architecture that will meet or exceed the requirements in a cost effective fashion. By resources we mean any hardware or software entity needed to perform transactions initiated by customers. For example, if you are developing a telephone switching system, resources would be things like outgoing digital trunks, timeslots, tone detectors etc.
In this article we will focus on resource dimensioning using Erlang-B and Erlang-C formulas. Many times resource dimensioning is determined by simulating the system being developed. Simulating the system is often an expensive endeavor and in most systems reasonably good results can be obtained by using the Erlang formulas.
Key Concepts
Before we move any further, we need to understand some key concepts associated with resource dimensioning:
Busy Hour
The load handled by a system varies a lot based on the time of day and day of the week. Most systems are heavily loaded for a few hours in a day. The main objective of resource dimensioning is to make sure that the system performs well during these busy hours. This will make sure that the system has adequate resources to handle peak as well as off-peak traffic. Thus our discussions here will mainly focus on the load handling during the busiest hour in a day.
Erlang
Erlang is a unit of traffic measurement. Traffic in erlangs (E) can be defined as:

The usage time for all resources is divided by the total time interval. An example should clarify the definition. Consider a digital trunk with 31 voice circuits. If each circuit has been busy for half an hour during a one hour measurement interval, the erlang calculation would be as follows:
- Usage time for all resources is 30 min * 31 = 930 minutes
- total time is 60 minutes
- Thus the total traffic in erlangs is 930/60 = 15.5 erlangs
Blocking Probability
The blocking probability defines the chance that a customer will be denied service due to lack of resources. For example, a blocking probability of 0.01 means that 1% of the customers will be denied service. Most of the time blocking probability calculations refer to the busy hour only. Blocking probability during the busy hour can be decreased by:
- Increasing the resources in the system
- Offering incentives and discounts to encourage usage during off-peak hours
Grade of Service
Grade of service is directly related to the the blocking probability. A higher grade of service guarantee to the customer means ensuring a low blocking probability during the busy hours. Providing a higher grade of service requires increasing the number of resources in the system. Conversely, you can reduce the number of resources to lower the cost, but at the expense of grade of service.
Service Time
Service time is the total time a resource is needed to handle one customer's request.
Wait Time
The total time customers will have to wait in the queue before they get any service.
Erlang Calculations
There is a tradeoff between resource dimensioning and grade of service. In this section we will examine these tradeoffs using the Erlang-B and Erlang-C formulas. The choice of the formula to use is dependent upon the handling of customers when all resources are busy.
- Erlang-B should be used when failure to get a free resource results in the customer being denied service. The customers request is rejected as no free resources are available.
- Erlang-C should be used when failure to get a free resource results in the customer being added into a queue. The customers stay in the queue until a free resource can be found.
Erlang-B
Erlang-B formula allows you to calculate the probability that a resource request from the customer will be denied due to lack of resources. The formula is:

Where:
- N is the total number of resources in the system
- E is the total traffic in erlangs
- Pb is the probability that a customer request will be rejected due to lack of resources
The formula works under the following conditions:
- The number of customers is much larger than the number of resources available to service them. In general, the formula gives acceptable results if the number of customers is at least 10 times the total number of resources (N).
- Requests from customers are independent of each other. This formula does not work if customer requests have been triggered by some common event like calling a talk show, natural calamity etc.
- Customer requests are blocked only when no resources are available to service them.
- When a customer cannot be serviced, the resource request is simply rejected. No attempt is made to queue the customer request.
- The customer does not retry the request after being denied service.
- The resource is allocated exclusively to one customer for the specified period. The resource cannot be shared with other customers.
Note: Using the above formula can be quite cumbersome. Fortunately there are a number of Erlang calculators available online.
Erlang-B Example
Lets consider an example where Erlang-B formula is used in analyzing performance requirements.
Consider the resource dimensioning of DTMF (Dual Tone Multi Frequency) receivers in a switching system. DTMF receivers are used to receive tones from the phone keypad and recognize the dialed digits. Thus a DTMF receiver should be allocated before dial-tone is fed to the subscriber. The DTMF receiver can be freed after digit dialing has been completed.
The resource dimensioning analysis for DTMF receivers follows:
Performance Requirements
- Every XEN processor in the switch shall be equipped with DTMF receivers
- DTMF receivers shall be allocated before dial-tone is fed and can be freed after digit dialing has been completed.
- Average duration of the digit dialing phase is 30 seconds.
- The probability of a call getting dropped due to lack of dial-tone shall not exceed 0.1%.
- A XEN processor shall handle at least 20,000 originations in the busy hour.
Requirement Analysis
We need to calculate the total number of DTMF receivers needed in XEN processor. We decide to use the Erlang-B formula as the system rejects a call if a DTMF receiver cannot be found. Most conditions for Erlang-B use are met. (The only condition that is not met is the requirement that failed customers do not retry.)
We will use the Erlang-B calculator from Erlang.com to compute the results. The calculator needs the busy hour traffic (B.H.T.) and the blocking probability. In our example, the busy hour traffic can be computed using the erlang formula covered above. The total erlang traffic for the DTMF receivers is:
B.H.T. = (20,000 orig/sec * 30 sec) / (3600 sec) = 167 Erlangs
Blocking probability = 0.1 % = 0.001.
With these numbers, the calculator returns a total number of lines as 202. Thus we need a total of 202 DTMF receivers.
Resource Dimensioning
We can use the DTMF circuit number to determine our hardware equipage. Lets say we plan to use a DSP card with 4 DSPs and each DSP can handle 16 DTMF receivers. Thus each DSP card handles 64 DTMF receivers. So we will need four DSP cards for DTMF receiver handling on a XEN (We have extra capacity as can handle 256 DTMF receivers and we need only 202).
Erlang-C
Erlang-C formula allows you to calculate the probability that a customer will have to wait for a resource. The formula is:
Where:
- Pc is the probability that a customer will experience a non zero delay in obtaining a resource
- E is the total traffic offered (in Erlangs)
- N is the total number of resources available
This formula is applicable under the following conditions:
- Customer requests are Poisson arrivals (See the article on M/M/1 Queueing)
- Service times are exponentially distributed (See the article on M/M/1 Queueing)
- Customers do not abandon resource requests while waiting for a resource
- Requests from customers are independent of each other. This formula does not work if customer requests have been triggered by some common event like calling a talk show, natural calamity etc.
- The resource is allocated exclusively to one customer for the specified period. The resource cannot be shared with other customers.
- The number of customers is much larger than the number of resources available to service them. In general, the formula gives acceptable results if the number of customers is at least 10 times the total number of resources (N)
Note: Using the above formula can be quite cumbersome. Fortunately there are a number of Erlang calculators available online.
Example
Lets consider the installation of a taxi service in a small town. Here we need to determine the total number of taxis needed to provide a particular grade of service. Again our analysis is divided into the following steps:
Performance Requirements
- The deployed system shall handle a peak load of 200 taxi requests in the busy hour
- Average length of a taxi trip in the town is 30 minutes
- During the busy hour, no more than two customers should have to wait more than 15 minutes for a taxi
Requirement Analysis
We will use Erlang-C for this computation as queueing of requests is involved. This analysis is based on the following assumptions:
- Taxi requests are Poisson arrivals (See the article on M/M/1 Queueing)
- Duration of the taxi service is exponentially distributed (See the article on M/M/1 Queueing)
- Customers do not abandon or cancel the taxi requests when waiting for one
- The first taxi to be freed will be able to service the next customer (this assumption is only an approximation that works for a small town. In a big city, a customer might have to wait for a taxi to free up in a nearby area)
- The 30 minute length of the taxi trip includes the time taken to drive from the last drop-off point to the next customer pickup.
We will be using freeware version of the cc-Modeler (by KoolToolz.com) for this analysis. The tools terminology is geared towards call center applications but it should work just fine for our taxi service. The tool needs the following inputs:
- Number of taxi requests in the busy hour: 200
- Average duration of a taxi trip: 30 minutes
- No more than 2 customers should wait for more than 15 minutes. This translates to 99% of the time, wait for a taxi should be less than 15 minutes.
When these numbers are given to the tool, the results are:
| Number of taxis needed during the busy hour | 108 |
| Percentage of time taxi drivers are driving during the busy hour | 93% |
| Taxi requests handled without wait | 67% |
| Maximum wait time for a taxi | 15 min 42 sec |
| Average number of customers waiting for a taxi during the busy hour | 4 |
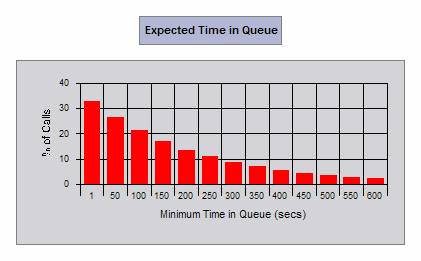
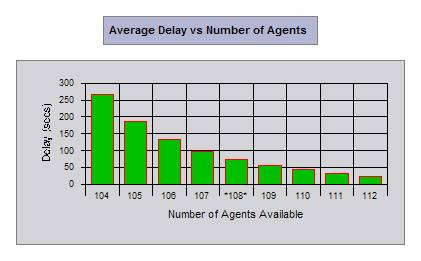
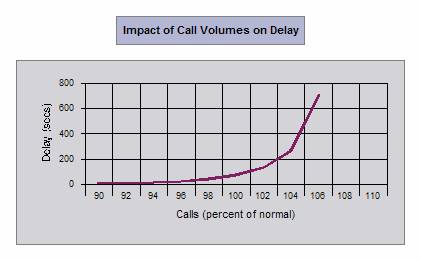
We have also obtained the following graphical results. Just hover your mouse over the graphs to see the meaning of these graphs in our example.
 |
 |
|
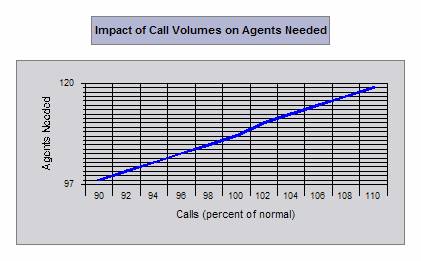 |
Resource Dimensioning
From the above analysis we conclude that a total of 108 taxis are needed in the busy hour. The taxis needed during other times can also be calculated in a similar fashion.